

Second Quarter 2025 Review: Why International Diversification Matters
The second quarter of 2025 served as a reminder that, even in a world of constant news, markets tend to focus on what matters most in the long run: interest rates and corporate earnings. Here’s a quick recap of the most important developments and how they shaped investment returns across major asset classes.
U.S. Economy:
Growth slowed slightly but remained positive. The U.S. job market remains strong, although wage growth has moderated. Consumer spending—especially on services like travel and dining—held up well, suggesting that households aren’t feeling the pinch just yet.
In Europe, economic activity remained sluggish, particularly in Germany and France, with political uncertainty further exacerbating investor caution following the far-right gains in the EU elections. Meanwhile, ongoing conflicts in the Middle East and Ukraine continued to weigh on global sentiment, but neither caused major disruptions this quarter.
Interest Rates and Inflation:
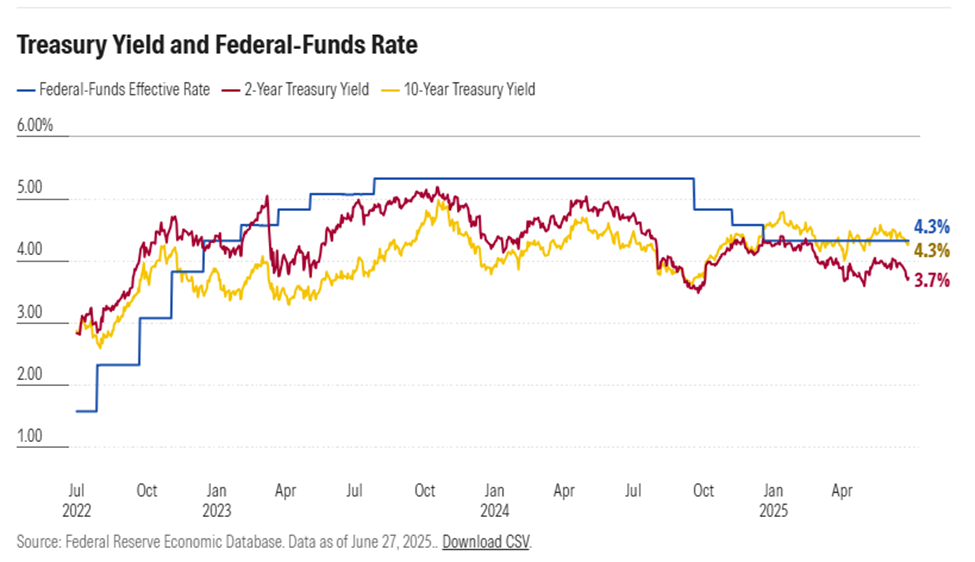
The Federal Reserve kept interest rates steady, signaling that while inflation has cooled from its 2021–2023 highs, it is in no rush to cut rates too quickly. Core inflation (which strips out food and energy) ticked down but remained just above the 2% target. The market had hoped for rate cuts by now, but uncertainty about the impact of tariffs or expanding fiscal deficits has kept the Fed cautious.
Asset Class Performance
U.S. Stocks:
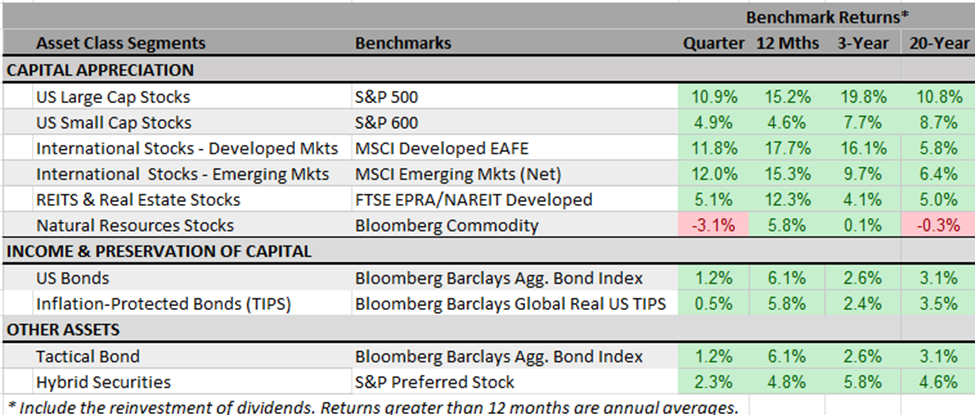
Following an almost 20% dip bottoming out in early April, the S&P 500, a proxy for the U.S. market, rose 10.9% in Q2, building on strong gains from the past twelve months. Big tech once again led the way, with AI-related companies and chipmakers continuing to dominate.
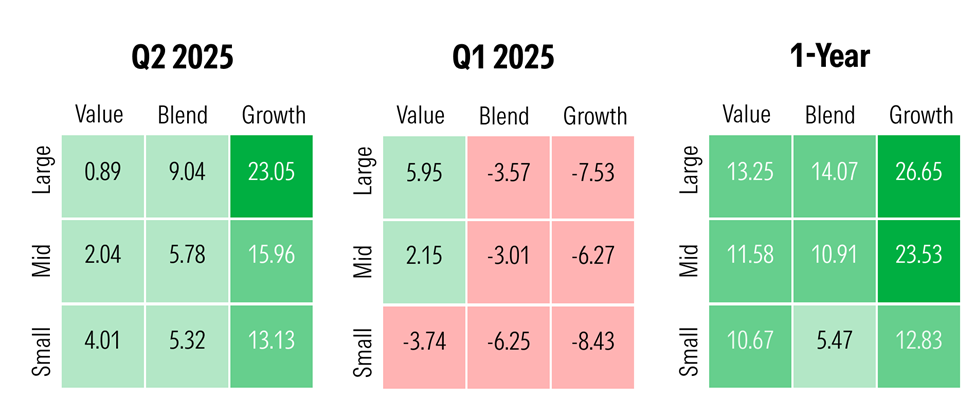
However, the rally broadened out somewhat, with financials and consumer discretionary stocks showing signs of life. Small and value stocks underperformed, marking a complete reversal from the first quarter.
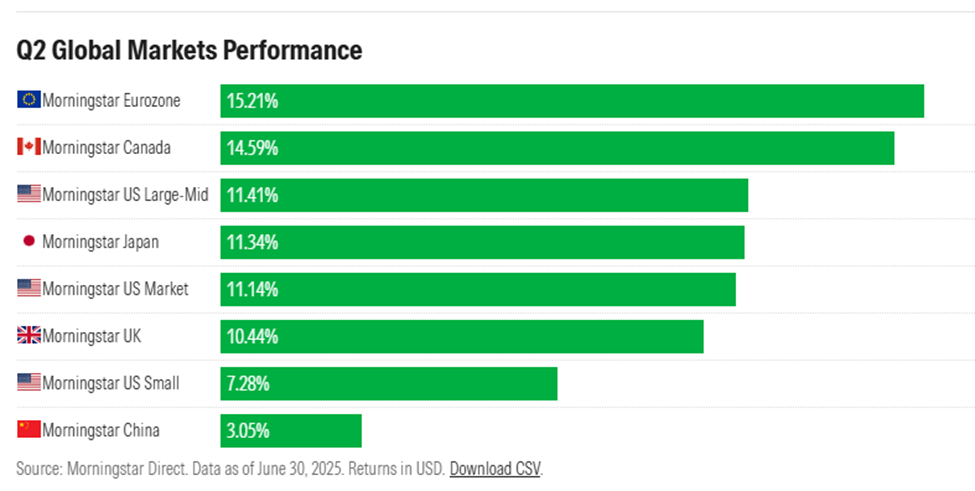
International Stocks:
Developed international markets posted even better gains—11.8% for the quarter—and continued to lead the performance charts for the past 12 months. Emerging markets also rose nicely—12% during the quarter—despite China’s ongoing property troubles and mixed policy signals from Beijing.
Bonds:
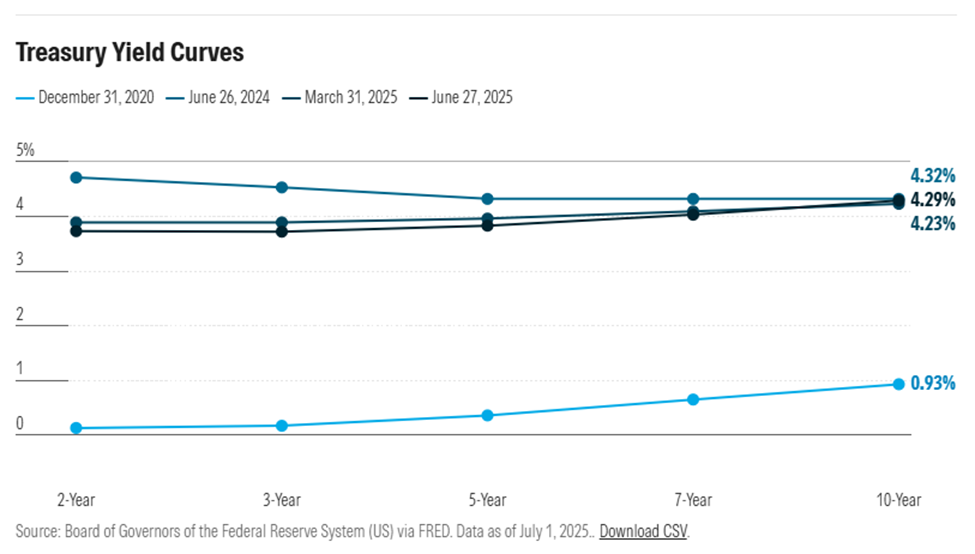
U.S. Treasuries saw moderate volatility: 10-year yields rose to 4.6% in late May, driven by tariff threats and inflation fears, before cooling back to 4.2% by quarter’s end. Overall, the Bloomberg U.S. Aggregate Bond index rose roughly 1.2%.
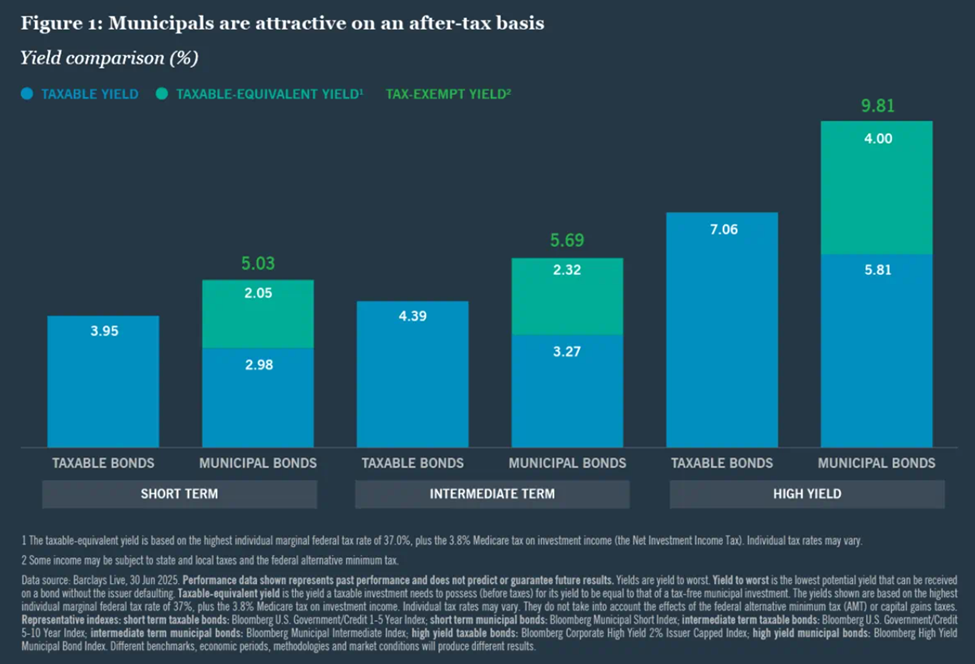
Municipal bonds lagged the broader bond market. The Bloomberg Muni index was slightly down (-0.1%) during the quarter. Pressure from record issuance weighed, sending 20-year yields up 0.2% for the best credits, while 2-year yields dipped, steepening the yield curve. The Bloomberg Municipal Intermediate Bond Index ended the period at 3.4%. For top tax bracket investors (37% + NIIT of 3.8%), this represents a taxable-equivalent yield of 5.7%.
With price pressures cooling off, bond returns over the past 12 months are solidly above the rate of inflation.
Real Estate and Commodities
Real estate investment trusts (REITs) rebounded mildly, benefiting from lower inflation readings. Commodities were mixed: oil prices dipped slightly as global demand softened, while gold prices held steady amid geopolitical uncertainty and lingering hopes for further rate cuts. Overall, shares of Natural Resources companies were in the red for the quarter.
Why International Diversification Matters
2025 highlights a key lesson: while U.S. markets have often taken the spotlight over the last decade or so, valuable global opportunities to enhance portfolio returns remain. International stocks played a significant role this year, contributing positively to returns as different regions of the world responded to their own economic and political developments. European stocks were a bright spot.
As we argued in the first quarter, we strongly believe that maintaining a well-balanced equity portfolio with international exposure can help investors navigate domestic market volatility and participate in long-term global growth.
That leads to a common question: How much should be allocated to non-U.S. stocks? We begin by examining the U.S. share of the global stock market and its corresponding share of the worldwide economy.
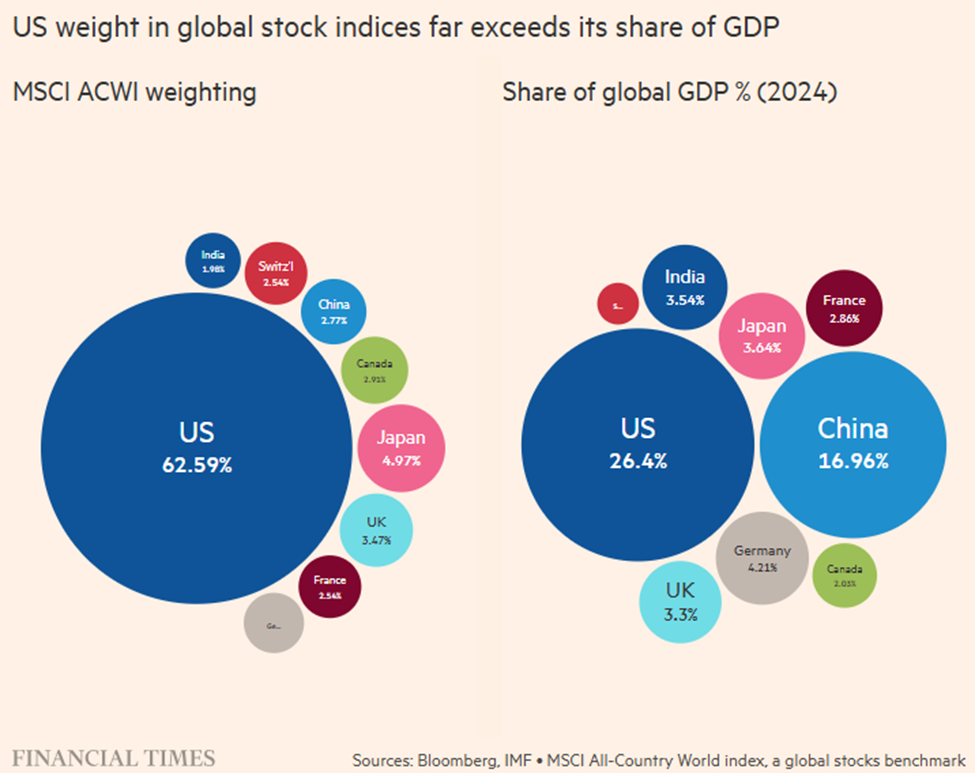
What we see is a big gap. The U.S. commands a much larger share of the global stock index, not because its economy is dramatically larger, but because its stock market is more developed, more accessible, and home to many of the world’s most innovative and profitable companies. In contrast, regions like Europe may have large economies but less prominent public securities markets.
There’s also a currency factor at play: As the chart below illustrates, the U.S. dollar has been volatile over time but has risen steadily since the end of the financial crisis in 2009, increasing the weight of U.S. markets relative to those of other countries.
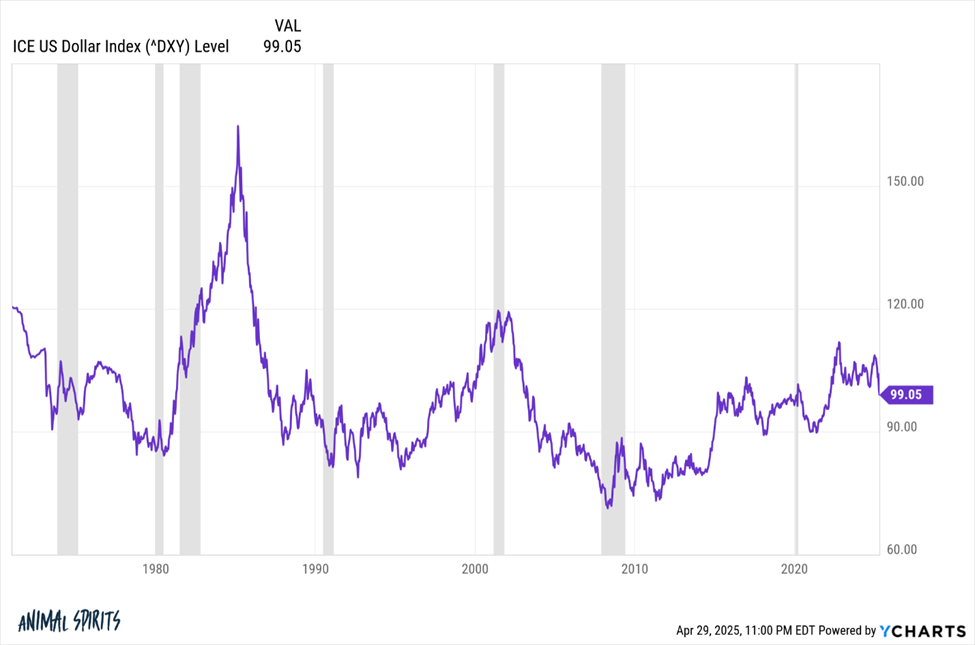
Historically, when the U.S. dollar is strong, returns on foreign stocks tend to lag. Inversely, when the dollar weakens (e.g. 1985-1991 & 2002 through 2009), international stocks outperform. Here’s a chart showing the data for European vs. U.S. stocks:
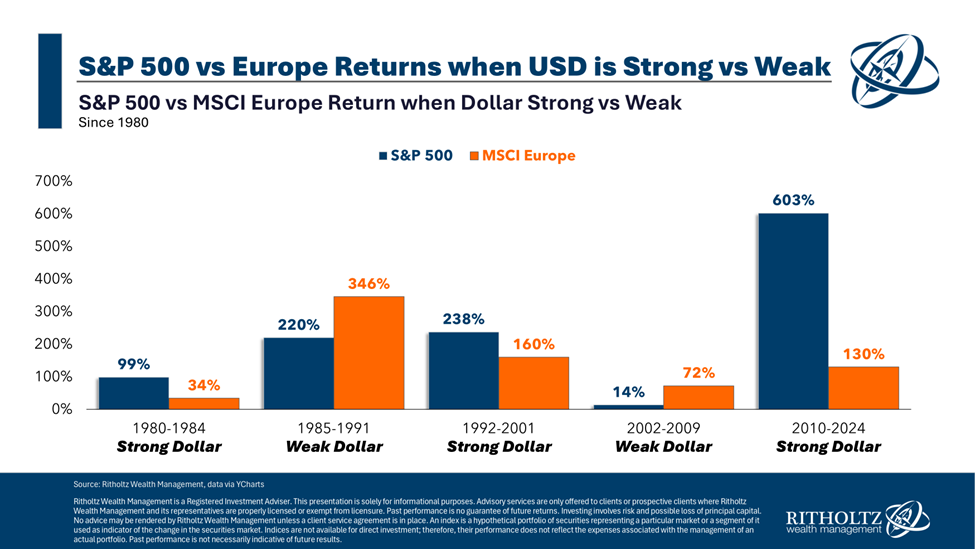
This relationship isn’t guaranteed, but it seems logical: foreign companies earn and report profits in their local currencies, so a weaker dollar makes those earnings more valuable in dollar terms.
So, how do we decide on the correct international allocation?
Obviously, we seek to prioritize U.S.-denominated investments for our clients who reside in the U.S. and spend in dollars. This is particularly true of our fixed income investments (bonds, money market funds), which are 100% denominated in U.S. dollars.
On the stock side, it is also worth noting that the U.S. weight within the world index has climbed by over 20 percentage points in the past 25 years, while the relative weight of the U.S. economy has decreased. The pace of increase accelerated after 2014 from below 50%, fueled by the dominance of U.S. technology stocks. Today’s global investors might want to consider that they are now more exposed to the U.S. market than at any point in the past quarter-century.
Acknowledging this evolution, our portfolio construction strategy results in holding approximately 55% to 60% of the equity allocation in U.S.-based companies today. That’s about 5% less than the U.S. share of the global index over the same period.
This decision to overweight international stocks is further supported by the fact that their shares currently offer more attractive valuations and higher dividend yields, which should translate into stronger and less volatile returns in the future.
Our rebalancing discipline also plays a role over time in containing the relative growth of U.S. stocks: as their shares outperform the rest of the world, we regularly trim those gains and reinvest the proceeds into categories such as international and U.S. small-cap stocks that are priced more attractively.
Finally, we recognize the limitations of assigning a percentage based solely on a company’s location. The true economic exposure of our clients’ portfolios to the U.S. is likely understated: many multinational companies classified as “foreign” derive a significant portion of their earnings and economic value from the United States. Examples include Toyota, Samsung, Nestle, Unilever, Novartis, L’Oreal, etc.
Only time will tell how this slightly contrarian positioning plays out. Success in investing is essentially about probabilities and reducing mistakes. Based on historical cycles in relative performance and valuation fundamentals, we believe our approach enhances the odds of generating better long-term risk-adjusted returns.
One of Bristlecone Value Partners’ principles is to communicate frequently, openly and honestly. We believe that our clients benefit from understanding our investment philosophy and the process behind it. Our views and opinions regarding investment prospects are "forward-looking statements," which may or may not be accurate over the long term. While we believe we have a reasonable basis for our appraisals and confidence in our opinions, actual results may differ materially from those we anticipate. Information provided in this blog should not be considered as a recommendation to purchase or sell any particular security. You can identify forward-looking statements by words like "believe," "expect," "anticipate," or similar expressions when discussing particular portfolio holdings. We cannot assure future results and achievements. You should not place undue reliance on forward-looking statements, which speak only as of the date of the blog entry. We disclaim any obligation to update or alter any forward-looking statements, whether as a result of new information, future events, or otherwise. Our comments are intended to reflect trading activity in a mature, unrestricted portfolio and might not be representative of actual activity in all portfolios. Portfolio holdings are subject to change without notice. Current and future performance may be lower or higher than the performance quoted in this blog. References to indexes and benchmarks are hypothetical illustrations of aggregate returns and do not reflect the performance of any actual investment. Investors cannot invest directly in an index, and returns do not account for the deduction of advisory fees or other trading expenses. There can be no assurance that current investments will be profitable. Actual realized returns will depend on, among other factors, the value of assets and market conditions at the time of disposition, any related transaction costs, and the timing of the purchase. Economic factors, market conditions, and investment strategies will affect the performance of any portfolio, and there can be no assurance that a portfolio will match or outperform any particular index or benchmark. Past Performance is not indicative of future results. All investment strategies carry the potential for profit or loss. Changes in investment strategies, contributions, or withdrawals can materially alter the performance and results of a portfolio. Different types of investments involve varying degrees of risk, and there can be no assurance that any specific investment will be suitable or profitable for a client's investment portfolio. This content is developed from sources believed to provide accurate information, and it may not be used to avoid any federal tax penalties. Please consult legal or tax professionals for specific information regarding your individual situation. The opinions expressed and material provided are for general information and should not be considered a solicitation for the purchase or sale of any security.