

First Quarter 2019 Review: Make Hay While the Sun Shines
Quarterly Markets Review - Q1 2019
After a dismal end to 2018, stock and bond markets rebounded in Q1, with the S&P 500 delivering its best quarter (+13.6% including dividends) since the financial crisis 10 years ago. Some factors positively influencing investor sentiment included: an end to the U.S. government shutdown, improving prospects for a U.S-China trade agreement, and a shift to more accommodative monetary policy from the U.S. Federal Reserve. Every global asset class represented in our clients’ portfolios appreciated in Q1, and most equity indexes notched double-digit returns:

Domestic Equity Performance in Q1 2019
Among domestic equities, gains were broad-based, yet small and mid-cap growth stocks performed the best; large cap value stocks were relative laggards (up “only” about 10%). All sectors within the S&P 500 index had positive returns, but technology and real estate pulled up the average for the index overall:
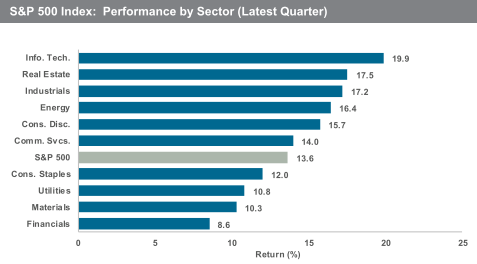
Source: Baird Q1 2019 Market Chartbook (p.18)
Other Categories' Performance in Q1 2019
Commodities, as usual, were a mixed bag. Oil prices rose 30% in the quarter and certain industrial metals also saw double-digit gains. However, precious metals were flat and most agricultural commodities continued a downward pricing trend. International equities enjoyed strong positive returns in Q1, with currency impact muted for U.S. investors. Emerging market (EM) equities showed more dispersion in returns; China was up 18% while Mexico, India, and Brazil appreciated in the mid-single digits. Notwithstanding a strong Q1, emerging market equities remain the worst-performing asset class in client portfolios over the past 12 months. We believe EM stocks remain undervalued relative to both their own historical average and in relation to U.S. equities, and that this bodes well for their potential future returns:

Source: JP Morgan Guide to the Markets, 3/31/19 (p. 54)
The Fed Blinks
After initiating a series of interest rate hikes in late 2015 (9 increases in 3 years, raising the fed funds rate from 0.25% to 2.5%), the Fed held steady in each of their last two meetings (December and March) and guided to no further rate increases for the remainder of 2019. Moreover, the Fed also indicated that Quantitative Tightening (QT) would be more limited in scope—and end sooner—than previously planned. Both factors represent an incrementally “looser” monetary policy (i.e. providing more liquidity to financial markets), bullish for stocks and bonds. Indeed, while the broad Barclays Aggregate Bond index increased 2.9% in Q1, credit-sensitive subsets of the bond market performed even better (junk bonds rallied 7.3%, and investment-grade corporate debt gained 5.1%).
Notwithstanding recent efforts at normalization, the Fed’s interventions from 2008-2015 represented an unusually long period of ultra-low interest rates, the consequences of which linger today. U.S. consumers, chastened by the harrowing experience of the 2008-09 financial crisis, moved swiftly to reduce their household debt burden, paying down debt where possible and exploiting low rates to refinance mortgages and student loans on more attractive terms. The result was a marked improvement in the debt service ratio of the average consumer:

Source: JP Morgan Guide to the Markets, 3/31/19 (p. 20)
On the other hand, the U.S. government ran persistent annual budget deficits over the past decade (with more deficits forecast for the foreseeable future), cumulatively increasing the national debt from about 60% of GDP to more than 105%. Ironically, the Fed’s bond-buying activities from 2008-14 (“Quantitative Easing”) artificially suppressed interest rates, allowing the U.S. government to borrow more cheaply than it otherwise would have. If not for Fed intervention, the national debt would likely be even larger than it is today.
Finally, corporate borrowers exploited low rates to increase leverage. Blue Chip companies with strong balance sheets borrowed opportunistically, frequently using low-cost debt to finance large-scale repurchases of their own stock (thereby boosting share prices). Even mediocre corporate credits could borrow at relatively attractive rates, extending a financial lifeline to companies which might have succumbed to insolvency in a more normal credit environment. One indication of the gradual deterioration in corporate credit quality is the proportion of corporate debt outstanding which is rated Baa (the lowest Moody’s rating that still qualifies as “investment grade”):

Source: JP Morgan Guide to the Markets, 3/31/19 (p. 36)
Thus far, investor appetite for high yield debt remains robust, because default rates are still well below the long-term average (about 1.1% currently, vs. a 30-year average of 3.7%).
Here Come the Unicorns
Interest rates are the “price” of borrowing money. Over the past decade, central banks throughout the developed world have engaged in monetary policy interventions which artificially suppressed interest rates in order to spur economic growth. But distorting a core price signal in financial markets understandably has spillover effects for virtually every other financial asset. Perhaps nowhere is this more apparent than in the world of venture capital (VC).
Over the past decade, VC investors incubated a growing stable of so-called “unicorns” – privately held startups (mostly tech firms) with valuations in excess of $1 billion. These firms are remaining private (and in many cases, unprofitable) for longer than ever before, thanks to a steady stream of VC investors willing to fund their rapid growth (and temporarily subsidize their losses). One of these purported unicorns, the biotech startup Theranos, raised more than $700 million from private investors over more than a decade—eventually valuing it at $10 billion—before the company was exposed as a fraud and dissolved. The unbelievable Theranos saga is the subject of a recent HBO documentary, “The Inventor: Out for Blood in Silicon Valley.”
In 2019, a new crop of unicorns planning IPOs includes: Lyft, Uber, Postmates, Slack, Pinterest, Instacart, Airbnb, and Palantir. Of the aforementioned group, all but Palantir are headquartered in San Francisco. The anticipated flood of new wealth (up to $250 billion of IPOs, by some estimates), combined with the already limited local housing supply has some SF real estate brokers licking their chops.
Ride-sharing company Lyft went public at the end of March with a valuation of $24 billion (11.4x sales). Between 2017 and 2018, Lyft’s revenues approximately doubled, yet their reported annual loss increased 32% to $911 million. A month after the IPO, Lyft’s share price is down 28%. Uber, which had contemplated a $120 billion IPO last fall, subsequently lowered that target to $100 billion in early April, before lowering it again in recent days to about $84 billion—an acknowledgement of the market’s poor reaction to Lyft’s offering. Though Uber is much larger than Lyft in terms of revenues, it is also growing at a slower rate, and still decidedly unprofitable (Uber lost $1.8 billion in 2018). Clearly, both firms are growing sales much faster than the average U.S. firm. But core to the investment thesis of platform companies like Uber and Lyft is a presumption that at some larger scale, network effects and operational leverage will lead to profits. In Uber’s case, $50 billion of annual gross bookings and $11.3 billion of revenue have yet to put the firm in the black. Notwithstanding this generous VC subsidy (Uber has reported over $10 billion of losses since 2016), revenue growth is slowing and the company is facing a quiet rebellion from drivers who do not feel adequately compensated. Public investors should be skeptical. Caveat emptor, as they say.
Bristlecone Large Cap Value
(Not all clients of Bristlecone are invested in our Large Cap Value Equity portfolio strategy, depending on the size of the overall portfolio, and the client's objectives and constraints)
After the deduction of our management fee, the median Bristlecone Large Cap Value (LCV) portfolio outperformed both the S&P 500 and the Morningstar Large Value Index. Consistent with the broader market, some of the best performing LCV stocks in Q1 were in the technology sector, and we trimmed or sold some of these positions due to valuation, including Keysight Technologies (KEYS) and Hewlett Packard Enterprise (HPE). On the other hand, we also initiated a small position in Facebook (FB) after the stock dropped nearly 40% from its peak last summer. Finally, we added to long-time holding Weyerhaeuser (WY) after a decline in U.S. housing starts and retaliatory Chinese tariffs on U.S. lumber exports clouded the demand picture for their product. In our view, the tariff impact is likely to be transitory, and U.S. housing starts are still below the normalized level of production necessary to meet the demand from new household formation. As with many of our long-term holdings, we’ve continuously owned WY for more than a decade, but have adjusted the position size during that time as the stock price fluctuates around our estimate of intrinsic value.
Bristlecone has a new website!
We'd like to invite you to visit our newly redesigned website. We've been hard at work on it for the past few months and hope that you’ll find it more user-friendly and informative. Our goal with the redesign was to make it easier to navigate and find timely information. It is also a better reflection of how we help investors today.
Bristlecone is focused on delivering investment results, not marketing. Our new clients are almost exclusively referred to us by existing clients that we’ve worked with over the years. One of our goals with this new website was to make it easier and convenient for referrals to learn more about our process and our services before contacting us: feel free to encourage your family members, friends or associates to check it out or subscribe to our commentary.
We plan on adding new content over time, with a sharper focus on personal finance issues that matter to you. Surf around our site and let us know what you think.
As always, we welcome follow-up questions on any of the topics in this commentary, or about your specific portfolio. Thank you once again for your trust in our services.
Questions? We'd love to help!
Ready for a Better Way to Investing?
At Bristlecone Value Partners our investment decisions are driven by independent thinking and a solid foundation of research. We think of our clients as investment partners and are firm believers in eating our own cooking.
One of Bristlecone Value Partners’ principles is to communicate frequently, openly and honestly. We believe that our clients benefit from understanding our investment philosophy and process. Our views and opinions regarding investment prospects are "forward looking statements," which may or may not be accurate over the long term. While we believe we have a reasonable basis for our appraisals, and we have confidence in our opinions, actual results may differ materially from those we anticipate. Information provided in this blog should not be considered as a recommendation to purchase or sell any particular security. You can identify forward looking statements by words like "believe," "expect," "anticipate," or similar expressions when discussing particular portfolio holdings. We cannot assure future results and achievements. You should not place undue reliance on forward looking statements, which speak only as of the date of the blog entry. We disclaim any obligation to update or alter any forward-looking statements, whether as a result of new information, future events, or otherwise. Our comments are intended to reflect trading activity in a mature, unrestricted portfolio and might not be representative of actual activity in all portfolios. Portfolio holdings are subject to change without notice. Current and future performance may be lower or higher than the performance quoted in this blog.
References to indexes and benchmarks are hypothetical illustrations of aggregate returns and do not reflect the performance of any actual investment. Investors cannot invest in an index and returns do not reflect the deduction of advisory fees or other trading expenses. There can be no assurance that current investments will be profitable. Actual realized returns will depend on, among other factors, the value of assets and market conditions at the time of disposition, any related transaction costs, and the timing of the purchase.
Economic factors, market conditions, and investment strategies will affect the performance of any portfolio and there can be no assurance that a portfolio will match or outperform any particular index or benchmark. Past Performance is not indicative of future results. All investment strategies have the potential for profit or loss; changes in investment strategies, contributions or withdrawals may materially alter the performance and results of a portfolio. Different types of investments involve varying degrees of risk, and there can be no assurance that any specific investment will be suitable or profitable for a client's investment portfolio.